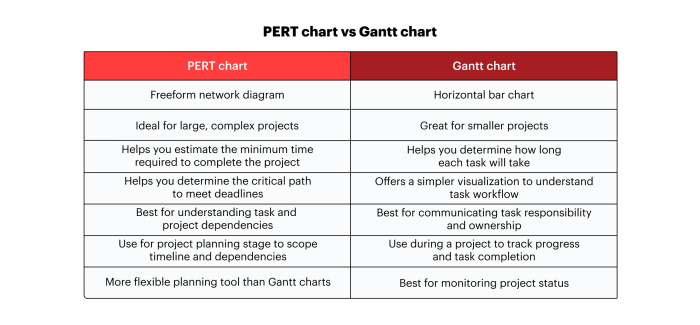
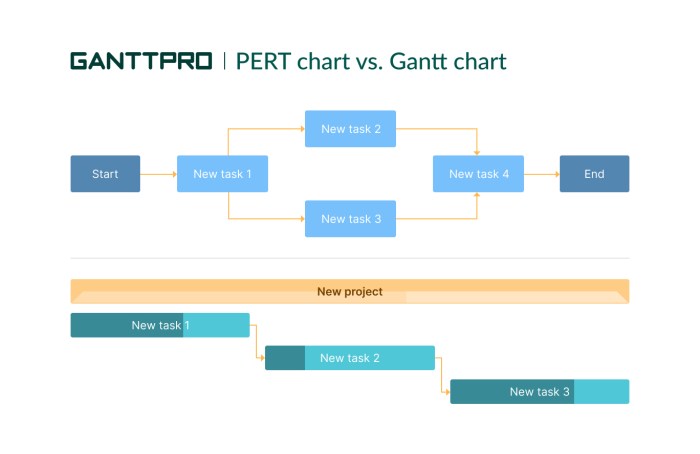
A Gantt chart graphs the relationships between tasks and activities in a project, providing a visual representation of the project schedule. This versatile tool helps project managers plan, track, and communicate project progress effectively.
Gantt charts are composed of horizontal bars that represent tasks, with their lengths indicating the duration of each task. The bars are arranged in a timeline, and dependencies between tasks are represented by arrows or lines connecting the bars. This visual representation allows project managers to quickly identify the critical path, which is the sequence of tasks that must be completed on time to ensure the project’s timely completion.
Understanding Gantt Charts
Gantt charts are visual representations of project schedules that depict the start and end dates of tasks, as well as the dependencies between them.
They are named after their inventor, Henry Gantt, and are widely used in project management to plan, schedule, and track projects.
Gantt charts consist of a horizontal timeline with tasks represented by bars. The length of each bar represents the duration of the task, and the position of the bar on the timeline indicates the start and end dates.
Components of a Gantt Chart, A gantt chart graphs the relationships between
- Tasks:The individual activities that make up the project.
- Dependencies:Relationships between tasks that indicate which tasks must be completed before others can start.
- Timeline:The horizontal axis that represents the project’s duration.
- Milestones:Key events or deliverables that mark significant progress in the project.
- Resources:The people or equipment required to complete the tasks.
Types of Relationships in Gantt Charts

Relationships in Gantt charts define the dependencies between tasks.
The most common types of relationships are:
- Finish-to-Start (FS):Task B cannot start until Task A is completed.
- Start-to-Start (SS):Task B cannot start until Task A starts.
- Finish-to-Finish (FF):Task B cannot finish until Task A is completed.
- Start-to-Finish (SF):Task B cannot finish until Task A starts.
Relationships are essential for creating accurate Gantt charts because they ensure that tasks are scheduled in the correct order and that the project’s overall duration is realistic.
Benefits of Using Gantt Charts: A Gantt Chart Graphs The Relationships Between

- Visualize Project Schedules:Gantt charts provide a clear and concise overview of the project’s schedule, making it easy to identify potential bottlenecks and conflicts.
- Improve Collaboration and Communication:Gantt charts are a shared resource that can be used by all project stakeholders to track progress and make informed decisions.
- Identify Critical Paths:Gantt charts can help identify the critical path, which is the sequence of tasks that must be completed on time to avoid delays in the project’s completion.
- Manage Resources:Gantt charts can be used to allocate resources to tasks and track resource utilization, ensuring that resources are used efficiently.
Limitations of Gantt Charts

While Gantt charts are a powerful tool for project planning, they have some limitations:
- Can Be Inaccurate or Incomplete:Gantt charts are only as accurate as the information that is entered into them. If the information is inaccurate or incomplete, the chart will not be a reliable representation of the project’s schedule.
- Not Suitable for Complex Projects:Gantt charts can become unwieldy and difficult to manage for complex projects with many tasks and dependencies.
- Do Not Account for Uncertainty:Gantt charts assume that all tasks will be completed on time, which is not always realistic. They do not account for uncertainty or risk, which can lead to inaccurate project schedules.
Q&A
What are the benefits of using a Gantt chart?
Gantt charts offer several benefits, including improved project visualization, enhanced collaboration, better resource allocation, and increased project control.
What are the limitations of Gantt charts?
Gantt charts can be limited by their inability to account for uncertainty, their reliance on accurate task estimates, and their potential complexity for large projects.
What are some best practices for creating effective Gantt charts?
To create effective Gantt charts, it is important to determine the appropriate level of detail, manage dependencies effectively, and use clear and concise labeling.